













Transaction Center
Time to bring it home. Find zipForm®, transaction tools, and all the closing resources you'll need. Except for the champagne — that's on you.
View the latest sales and price numbers. Find out where sales will be in upcoming months.
Get a roundup of weekly economic and market news that matters to real estate and your business.
Gain insights through interactive dashboards and downloadable infographic reports.
All Shareable Reports All Interactive DashboardsCatch up with the latest outreaches and webinars by the Research and Economics team.
C.A.R. conducts survey research with members and consumers on a regular basis to get a better understanding of the housing market and the real estate industry.
California Model MLS Rules, Issues Briefing Papers, and other articles and materials related to MLS policy.
Looking for information on how to file an interboard arbitration complaint? You've come to the right place! Find the rules, timeline and filing documents here.
Summaries and photos of California REALTORS® who violated the Code of Ethics and were disciplined with a fine, letter of reprimand, suspension, or expulsion.
The most recent edition of the Code of Ethics and Standards of Practice of the National Association of REALTORS® along with other important links to NAR information.
The California Professional Standards Reference Manual, Local Association Forms, NAR materials and other materials related to Code of Ethics enforcement and arbitration.
Designed to expand housing access, Proposition 37 proposes a $25 billion state bond program providing eligible middle-income homebuyers with fixed-rate second mortgages covering up to 17% toward the purchase of newly constructed homes.
Updates on C.A.R.'s legislative advocacy efforts in Sacramento.
Ballot MeasuresIssues briefing papers, handbooks and other background materials on local policy issues that affect real estate.
CREPAC, LCRC, IMPAC, ALF and the RAF comprise C.A.R.'s political fundraising arm.
The RAA: Protecting REALTORS® and Homeownership REALTOR® Action FundC.A.R. Senior Vice President of Government Affairs Sanjay Wagle sits down with California Insurance Commissioner Ricardo Lara to discuss the current state of California’s insurance market,
Learn how you can make a difference, by getting involved yourself or by passing along valuable information to your clients.


|
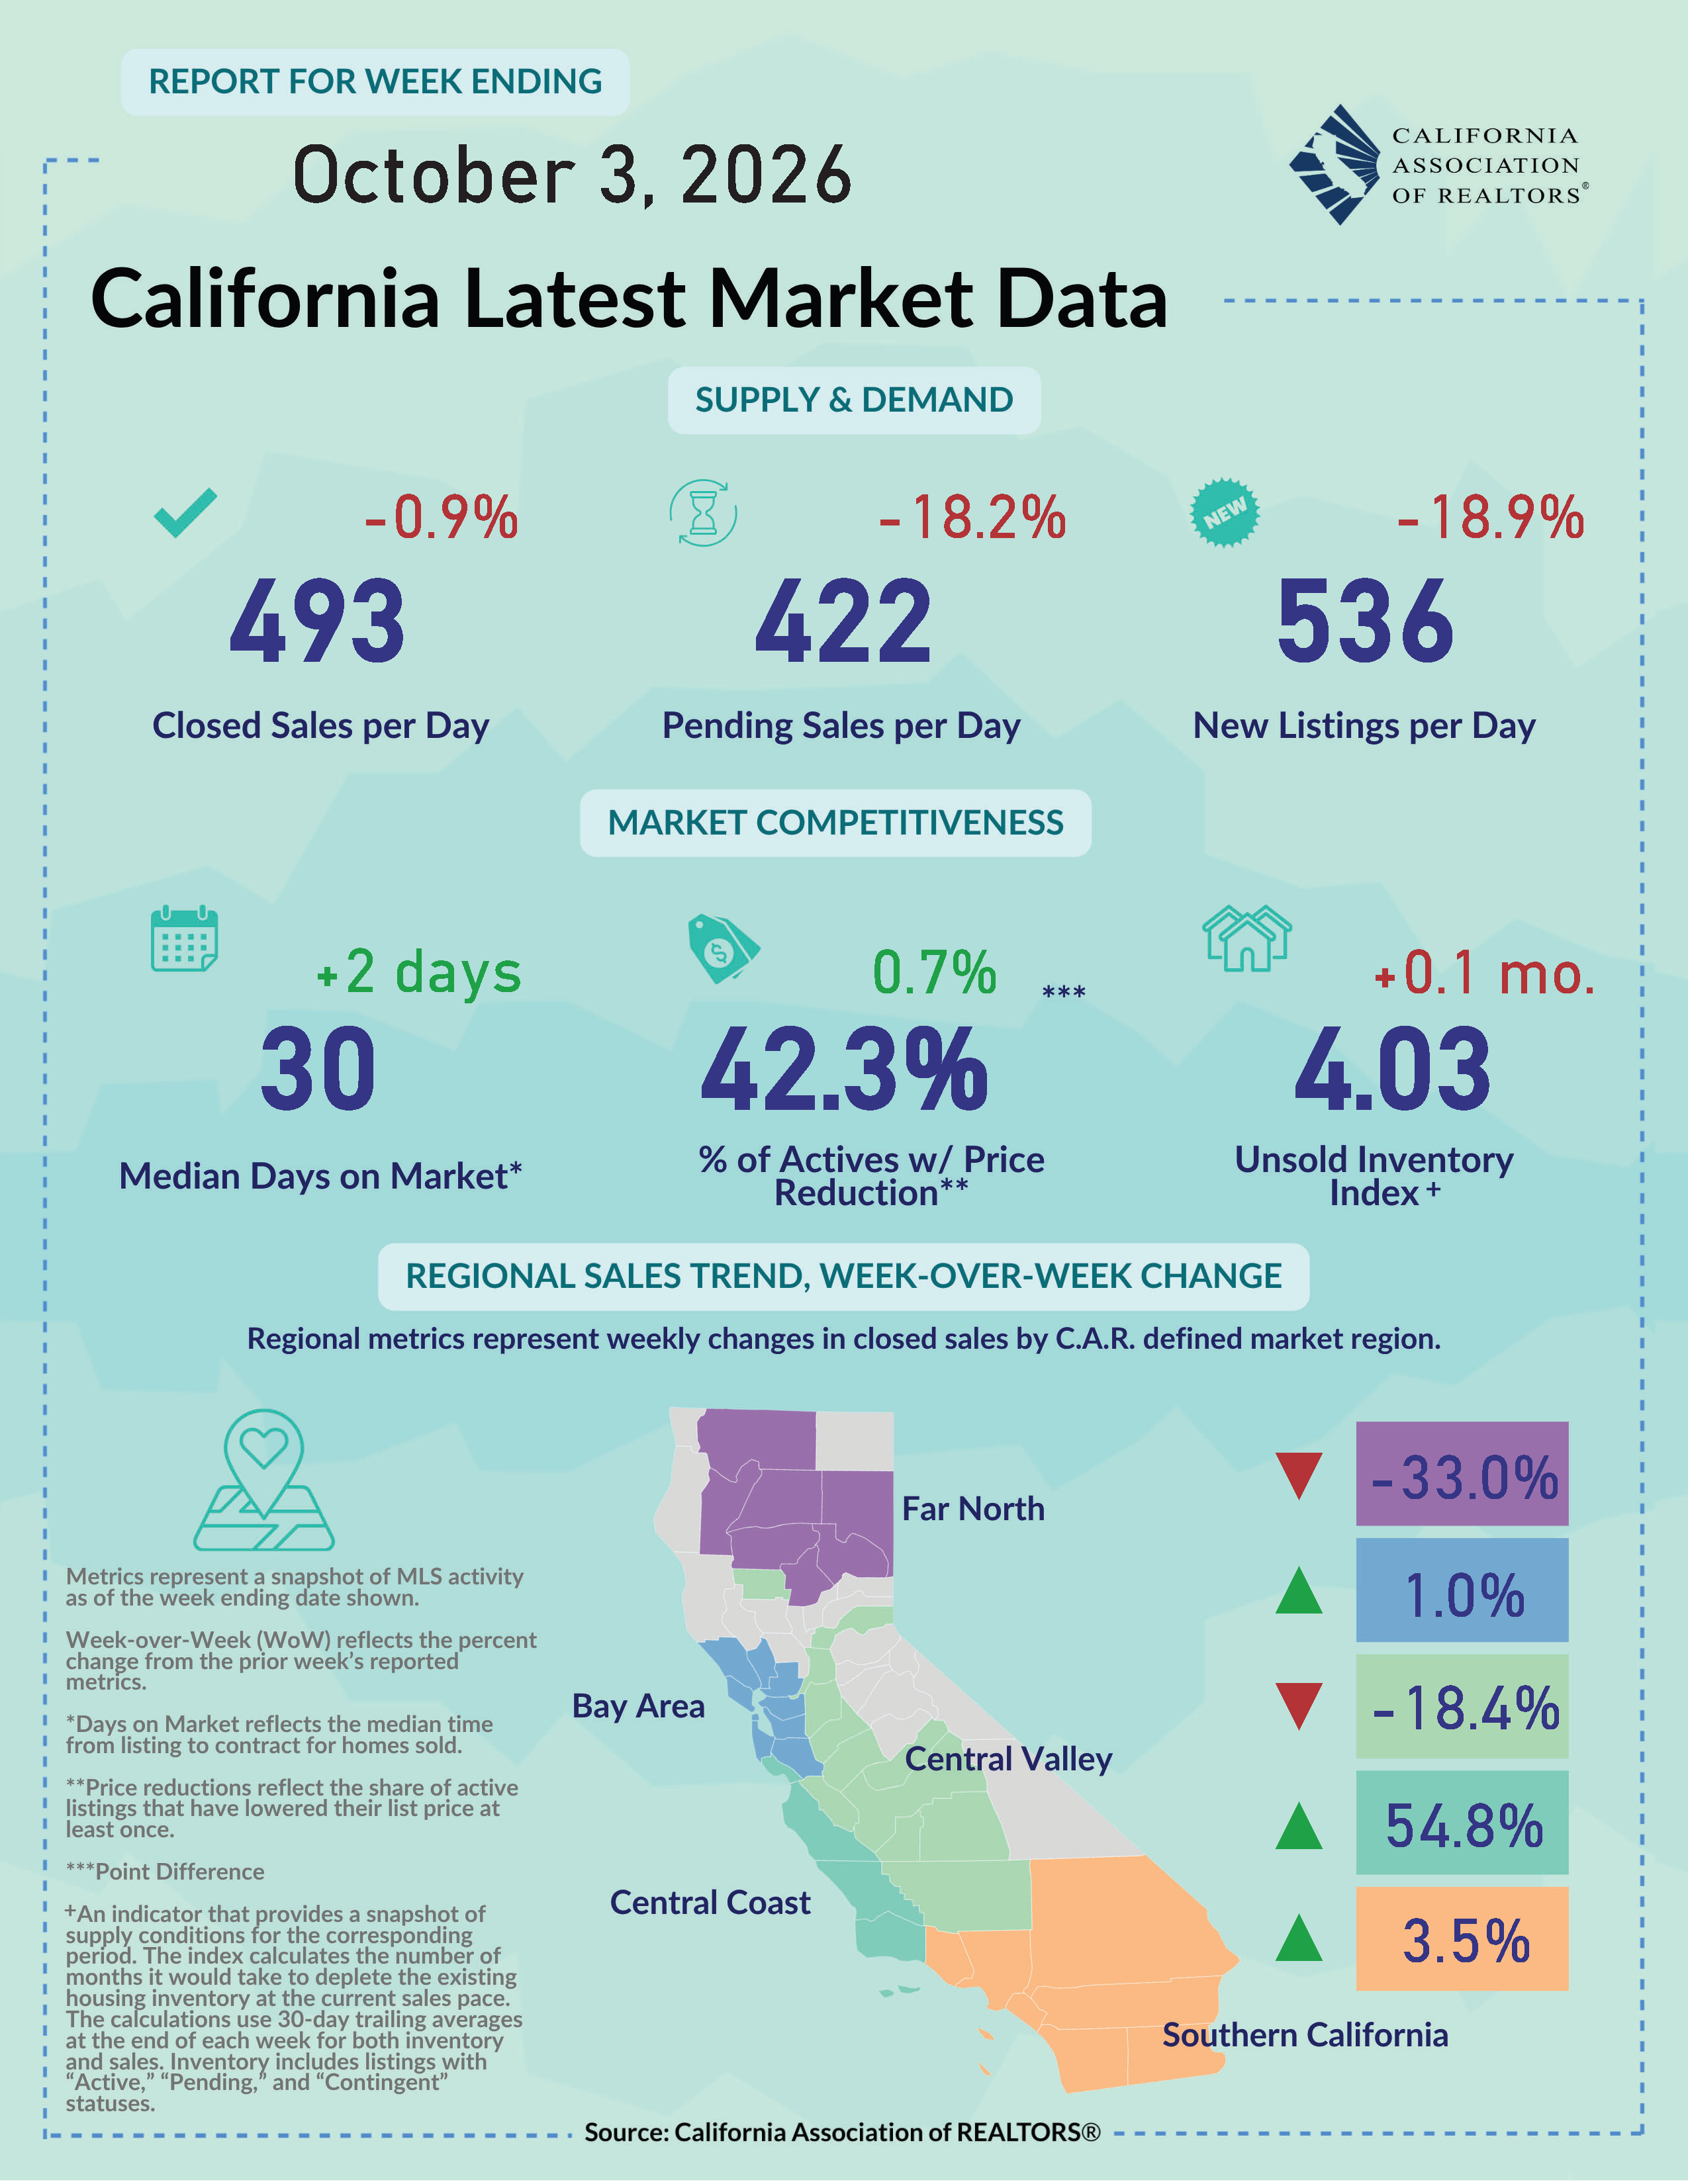
October 5, 2026 - Last week’s economic news offers little encouragement on the job market or consumer sentiment, as hiring slowed, unemployment edged higher, and confidence fell to a 12-year low. The weaker labor data, however, have reduced pressure on the Federal Reserve to rush into another rate hike at its upcoming October meeting. That does not necessarily translate into immediate relief for housing: mortgage rates have declined only modestly and remain high enough to discourage many homeowners from selling as some of the latest survey results suggest. Unless borrowing costs ease more meaningfully, the mortgage-rate lock-in effect will continue limiting new listings, slowing the turnover of existing homes, and keeping supply constrained for the rest of the year. Job growth slows and unemployment ticks up: The U.S. labor market softened noticeably in September, with nonfarm payroll employment increasing by 29k jobs, well below expectations and marking one of the weakest monthly gains of the year. Payroll estimates for July and August were also revised down by a combined 60k jobs, indicating slower hiring momentum than previously reported. Jobs gain was concentrated in health care, construction, and manufacturing, while most major industries saw little change overall. The unemployment rate edged up to 4.2% from 4.1%, while labor force participation rose to 61.8%, an indication that more people entered the workforce. Wage growth continued to moderate, with average hourly earnings rising only 0.1% in September and 3.0% from a year earlier, registering the sixth straight month of wages tracking below inflation. With the labor market losing momentum but remaining stable, markets expect the Federal Reserve to pause on further rate hike in the upcoming FOMC meeting at the end of October. Consumer confidence drops to lowest level since 2014: Americans felt more pessimistic last month as energy prices remained elevated and employment concerns lingered on. The U.S. Consumer Confidence Index fell 6.7 points to 81.9 in September from the prior month and reached a 12-year low, according to a monthly survey released by the Conference Board. Both the Present Situation Index and the Expectation Index dropped moderately from August, with the latter indicator - which reflects consumers’ short-term outlook - declining for the third consecutive month. Ongoing geopolitical tensions and sharply rising interest rates soured households’ moods, with consumer appraisals of current business conditions slipping into negative territory for the first time since September 2024. Perception of the labor market also worsened as more expected fewer jobs available in the next six months. The share of consumers anticipating higher interest rates over the next 12 months climbed further by 5.2 points to 68.4%. Higher borrowing costs and job market worries put some buyers on the sidelines, with fewer consumers planning to purchase cars, homes, or big-ticket items in the next six months. With consumers feeling more stretched about their budget and less secure about their jobs, consumer confidence could remain weak in the upcoming month. Lock in effect is still affecting homeowners’ decision to sell: According to the California Association of REALTORS® 2026 Housing Market Survey, homeowners are holding onto their properties longer than ever, with seller housing tenure reaching a record high of 15 years. The reasons are familiar: a low rate on the existing mortgage, a low property tax basis, and potential capital gains exposure. The lock-in effect remains very much intact as mortgage rates stay elevated, and with rates rising sharply in recent months, more owners will likely wait for relief before listing. That same math shows up elsewhere in the survey: the share of sellers who planned to buy another home (43%) fell to its lowest level in 14 years, as few are willing to trade a cheap mortgage for a costlier one. Encouragingly, outmigration dropped to a nine-year low, with most sellers choosing to remain in California. Longer tenure, however, means fewer listings recycling back into the market, keeping supply tight and inventory constrained. Rental market enters off-season but vacancy rate ticks down further: The apartment rental market moved into the traditional off-season last month and the dip in rent observed in September was more subdued than what was typically observed in past years, according to the latest Apartment List Rent Report. The national median rent in September was down 0.1% month over month to $1,388, falling for the first time in eight months. The decline, however, was more moderate compared to the average September monthly rent dip of -0.5% recorded between 2022 to 2025 and was below the pre-Covid level of -0.3% recorded between 2017 and 2019. It was the first month in years that rent growth has outpaced the pre-pandemic average, an encouraging sign that suggests a continual rebound of the rental market. The average national vacancy rate for multifamily homes also declined, with the corresponding index dipping to 7.0%, the lowest level since July 2025. As demand eases while construction slows, the rental market continues to normalize and is slowly moving back in line to more balanced market conditions as new units gradually get absorbed. Residential construction spending bounces back to a five-month high: Despite a surge in interest rates in the past few weeks, total construction spending unexpectedly ticked up in August after a dip in the prior month, according to the latest report released by the Census Bureau. Total construction outlay jumped to $2,203.1 billion in August, an increase of 0.9% from July’s $2,184.5 billion but remained 1.7% below August 2025’s $2,242.0 billion. Residential construction had a solid monthly gain of 1.1% in August and reached the highest level since March 2026. Private residential improvement posted the largest monthly gain of 2.5%, while private construction spending on single-family and multifamily both inched up mildly by 0.2%. Spending on all three sectors continued to decline on a year-over-year basis, however. Nonresidential improved from July by 0.7% but also increased 0.5% from its year-ago level, due largely to constructions of data centers. With mortgage rates at the highest levels since late 2023 and builder sentiment remaining weak, building activity in residential will likely pull back in the months ahead. Note: This summary report gets updated every Monday by 6:00 pm PST. Feel free to email us at [email protected] if you have any questions and/or feedback.
|
|